
When Flask app runs slow we need to identify what is the bottleneck. It can be an overloaded database, unresponsive external API, or heavy, CPU-intensive computation. This is the whole recipe on how to speed up Flask - find the source of sluggish performance. After the bottleneck is identified you can fight an underlying cause.
And here I assume that the underlying platform that runs Flask has enough resources to do so. In the rest of this post, I’ll explore some instruments that help with identifying bottlenecks.
DB model
Our app will use MySQL with many-to-many mapping from Students tables to Classes table - students can sign up for multiple classes and each class can accommodate many students.
I’m using Flask-SQLAlchemy here:
from flask_sqlalchemy import SQLAlchemy

app = Flask(__name__)
app.config['SQLALCHEMY_DATABASE_URI'] = 'mysql+pymysql://localhost:33066/perf'
db = SQLAlchemy(app)

student_identifier = db.Table('student_identifier',
                              db.Column('class_id', db.Integer, db.ForeignKey('classes.class_id')),
                              db.Column('student_id', db.Integer, db.ForeignKey('students.student_id')))


class Student(db.Model):
    __tablename__ = 'students'
    student_id = db.Column(db.Integer, primary_key=True)
    name = db.Column(db.String(80), nullable=False)
    classes = db.relationship("Class", secondary=student_identifier)


class Class(db.Model):
    __tablename__ = 'classes'
    class_id = db.Column(db.Integer, primary_key=True)
    name = db.Column(db.String(80), nullable=False)
    students = db.relationship("Student", secondary=student_identifier)
Views
Let’s create a couple of views. One to query all the students signed up for a class
@app.route('/roster')
def roster():
    class_id = request.args.get('class_id')
    class_orm = Class.query.filter_by(class_id=class_id).first_or_404()
    return jsonify([c.name for c in class_orm.students])
Another will query all classes a student has sighed up for.
@app.route('/my_class')
def my_class():
    student_id = request.args.get('student_id')
    student_orm = Student.query.filter_by(student_id=student_id).first_or_404()
    return render_template_string('<html><body>data: {{ data }}</body></html>', data=[c.name for c in student_orm.classes])
I’ll run flask in a development mode, as I’d like to find the bottleneck in my code and not in middleware such as nginx or uwsgi
if __name__ == '__main__':
    app.run(debug=True)
Profiling with werkzeug profiler
There is a built-in profiler in werkzeug - Flask’s development web server. To use it modify the main of the app.py:
if __name__ == '__main__':
    from werkzeug.middleware.profiler import ProfilerMiddleware
    app.wsgi_app = ProfilerMiddleware(app.wsgi_app, restrictions=[5], profile_dir='./profile')
    app.run(debug=True)
The profiler has 2 parameters:
- a number of slowest performing functions to show - I’m putting 5
- a directory where to put the details of the function calls
The result is available in the stdout:
PATH: '/my_class'
         8887 function calls (8615 primitive calls) in 0.038 seconds

   Ordered by: internal time, call count
   List reduced from 994 to 5 due to restriction <5>

   ncalls  tottime  percall  cumtime  percall filename:lineno(function)
        3    0.004    0.001    0.004    0.001 {method 'recv_into' of '_socket.socket' objects}
        2    0.001    0.000    0.001    0.000 /Users/as/.virtualenvs/flask-perf/lib/python3.6/site-packages/sqlalchemy/orm/interfaces.py:558(create_row_processor)
       28    0.001    0.000    0.001    0.000 {method 'update' of 'dict' objects}
       57    0.001    0.000    0.001    0.000 /Library/Frameworks/Python.framework/Versions/3.6/lib/python3.6/_weakrefset.py:58(__iter__)
      309    0.001    0.000    0.001    0.000 {built-in method builtins.getattr}
It shows that most of the time the program spent communication over the network. Now let’s have a look at what was accessing the sockets.
Profiler puts details of the requests in profile-dir directory in a *.prof files.
We can use snakeviz to visualize it:
pip install snakeviz
snakeviz profile/GET.my_class.38ms.1588862067.prof
It will open a diagram in a browser. In my case it looks like that:
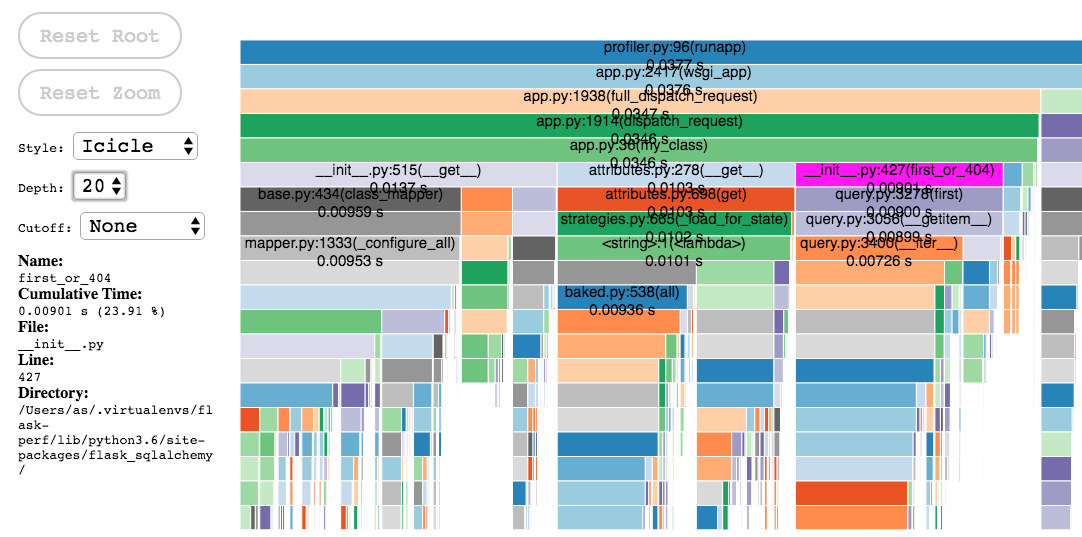 .
.
Hover over boxes on each call level to see what’s the function being called and how long did it take. If you want to find this costly method ‘recv_into’ of ‘_socket.socket’ you need to click on a box to zoom in.
Another way of visualizing of the profiler output is to use gprof2dot to convert prof file to
a dot file and xdot draw a graph from dot file
pip install gprof2dot
gprof2dot -f pstats profile/GET.my_class.38ms.1588862067.prof -o calling_graph.dot
xdot calling_graph.dot
The resulting graph is:
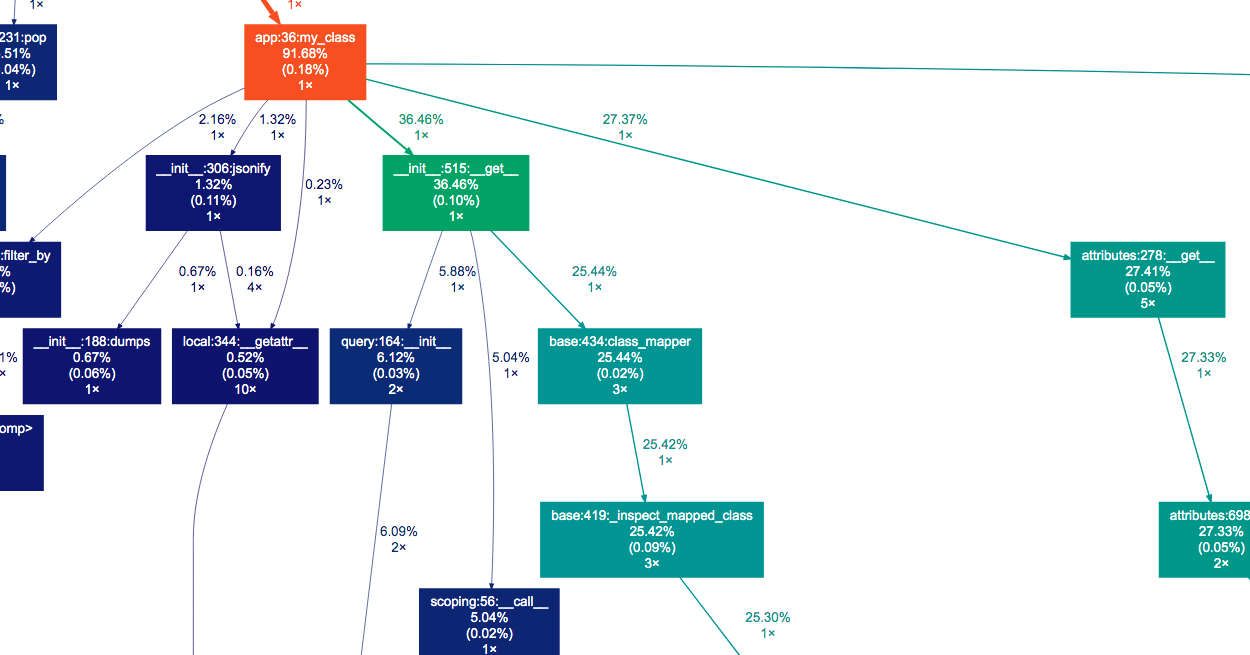
After investigating this visualization it’s clear that most time is spent executing sqlachemy code (no surprise - we only do a query to the database in the Flask)
Getting slow SQL queries
Since now we know that querying the database slows us down let’s investigate what queries we execute. There is an SQLAlchemy feature that allows us to get all the queries executed during the request. I’ll use after_request Flask hook to print them when the request is over:
from flask_sqlalchemy import get_debug_queries

app.config['SQLALCHEMY_RECORD_QUERIES'] = True

@app.after_request
def after_request(response):
    for query in get_debug_queries():
        if query.duration >= 0:
            print(query.statement, query.parameters, query.duration, query.context)
    return response
Each query returned by get_debug_queries has a duration attribute. In my case, I’m printing all queries (duration >= 0) but in a real case, I’ll be interested in ones that are longer than say 1s.
In stdout I now can wee the queries:
SELECT students.student_id AS students_student_id, students.name AS students_name
FROM students
WHERE students.student_id = %(student_id_1)s
 LIMIT %(param_1)s {'student_id_1': '43', 'param_1': 1} 0.01108407974243164 /Users/as/Desktop/flask-perf/app.py:40 (my_class)
Now I can substitute bind variables with values and put EXPLAIN before the query in SQL console to see how it was executed by the server:
EXPLAIN SELECT students.student_id AS students_student_id, students.name AS students_name
FROM students
WHERE students.student_id = 42
LIMIT 1;
| id | select_type | table | partitions | type | possible_keys | key | key_len | ref | rows | filtered | Extra |
|---|---|---|---|---|---|---|---|---|---|---|---|
| 1 | SIMPLE | students | ALL | 10016 | 10 | Using where |
The type column says that it was an ALL type query and it means that MySQL was unable to identify any keys that can be used. So if we set a proper index the query should run faster.
Flask-DebugToolbar
More high-level tools can profile Flask. One of them is a flask-debugtoolbar. It’s simple to install with pip install flask-debugtoolbar.
from flask_debugtoolbar import DebugToolbarExtension

app.config['SECRET_KEY'] = 'verysecretsuchwow'
app.config['DEBUG_TB_PROFILER_ENABLED'] = True
app.debug = True

toolbar = DebugToolbarExtension(app)
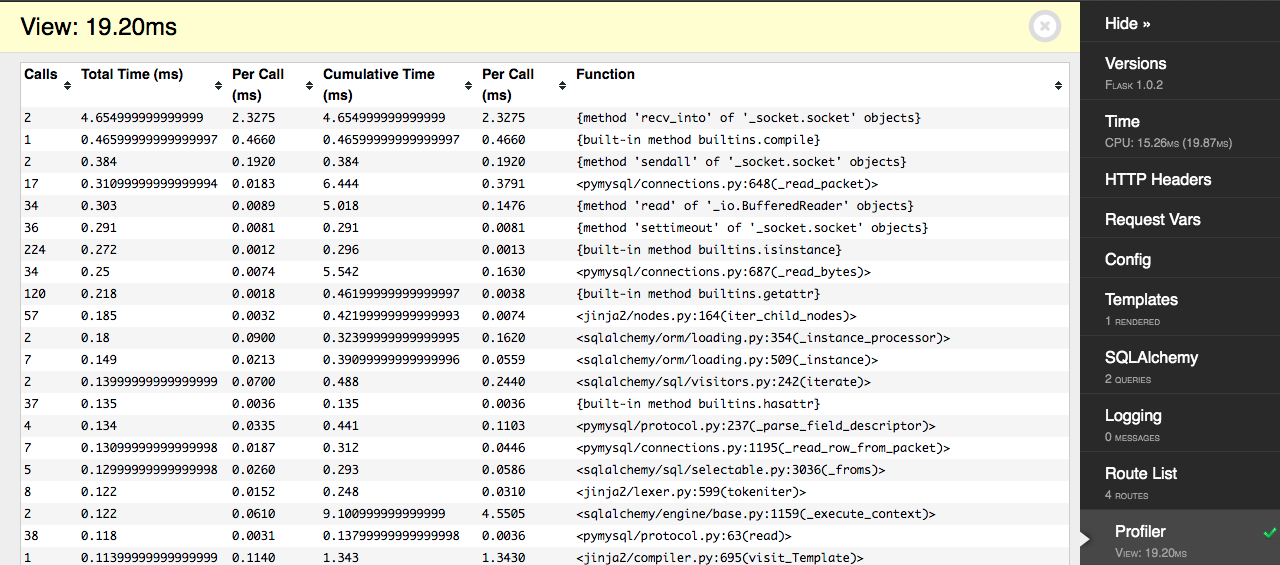
Now in every response with an HTML page, there will be a toolbar on a right-hand sight. There we can see SQLAlchemy queries and execute EXPLAIN right from the browser:
There is a profiler output as well:
API monitoring
All the mentioned methods need you to make an actual call to get the profiler data. They do not store the results of your user’s call, nor they provide statistics on what endpoints perform worst.
2 plugins allow monitoring such a performance: Flask-MonitoringDashboard and flask-profiler
Installation of both plugins is simple:
pip install flask_profiler Flask-MonitoringDashboard
Flask-MonitoringDashboard
The setup for the dashboard looks like this:
import flask_monitoringdashboard as dashboard
dashboard.bind(app)
The dashboard is using SQLite by default (you’ll get a .db file in the root directory of the project). The dashboard is available under /dashboard (default credentials are admin/admin)
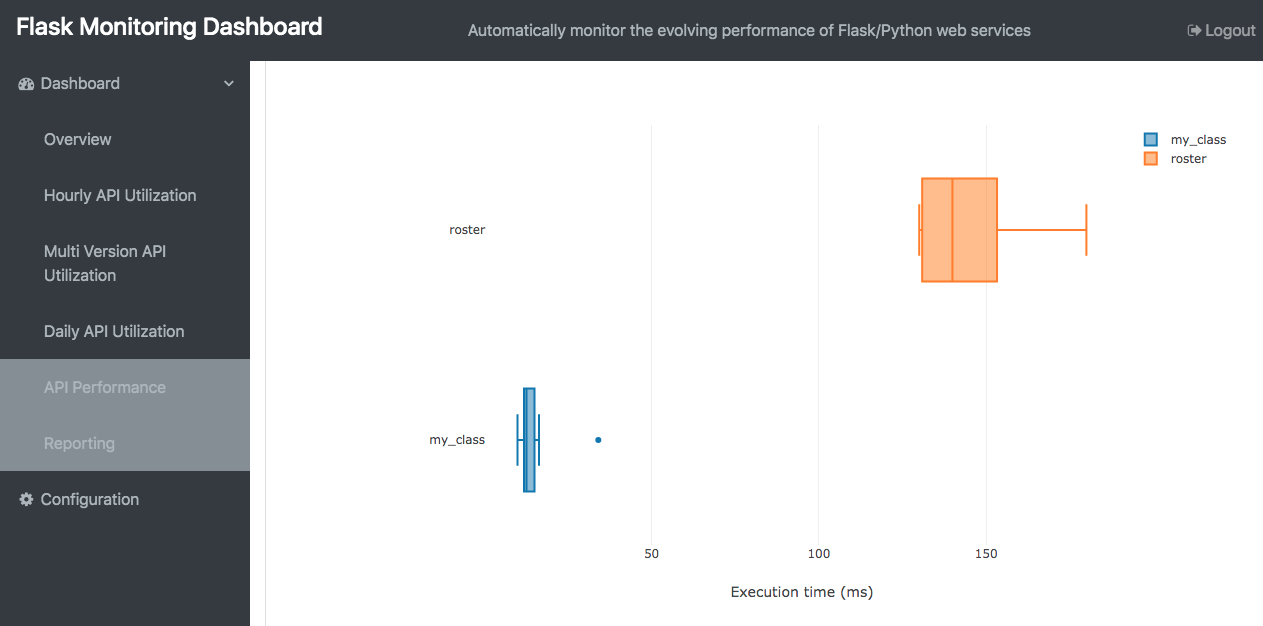
In the API performance section, you can find statistics (nice block diagrams) showing response time distributions of our endpoints:
In the overview section, you can select a log level. If you select #3 you will access a profiler data that shows the call stack and timings for every request being made

There are a bunch of configuration options this a profiler. See the docs here
flask-profiler
Setup the profiler like so:
from flask_profiler import Profiler
app.config["flask_profiler"] = {
    "enabled": app.config["DEBUG"],
    "storage": {
        "engine": "sqlite"
    },
    "basicAuth":{
        "enabled": True,
        "username": "admin",
        "password": "admin"
    },
    "ignore": [
        "^/static/.*"
    ]
}

Profiler(app)
The dashboard is also using SQLite by default (but MongoDB and SQLAlchemy are available backends). The dashboard is available under /flask-profile (default credentials are admin/admin)
On the overview page there is a statistics of our endpoint’s usage:
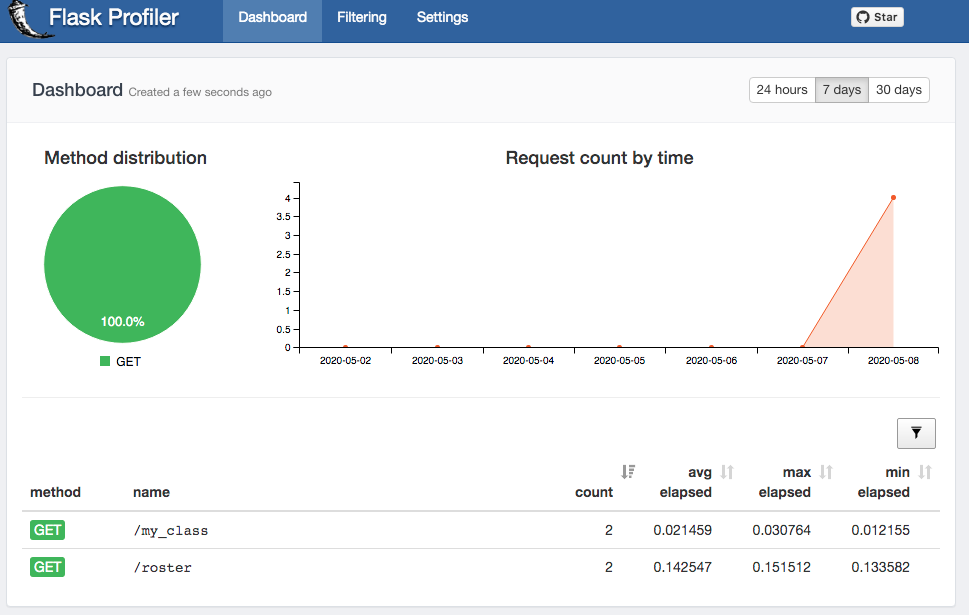
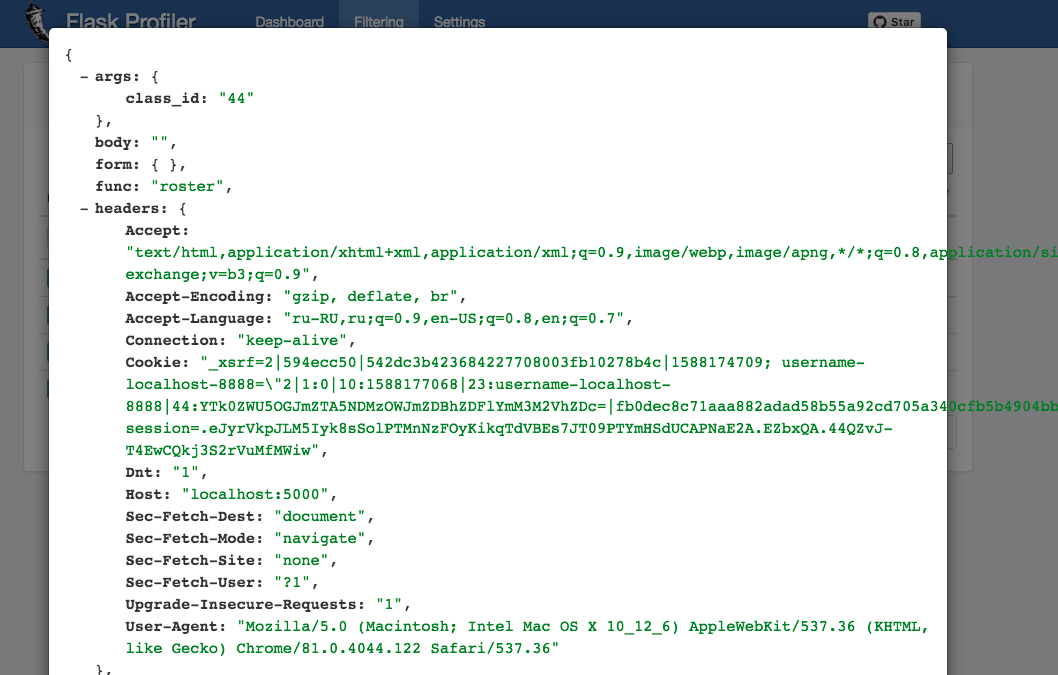
In the settings there is a list of all requests where we can see that was passed to the server:
Both dashboards are meant to be used when Flask is in debug mode and I wouldn’t put them on in a production environment. So the best approach to work with them is to enable them on a development machine and run a test using ab, siege, or JMeter and analyze the results afterward.
Final thoughts
Only after identifying an underlying cause for slow responses, you can start dealing with them. In my career I’ve encountered such situations:
-
In case if slow DB queries - use EXPLAIN to see if the server uses the index for querying the data.
-
Or you may spin up a read-replica DB to steer read requests to it if you’ve reached a limit with vertical scaling of the DB server.
-
If it’s a slow API or CPU intensive job - consider putting it in an async background job.
Please, reach me out on LinkedIn you you find this post useful and want to share your experience with slow Flask performance